
Quick Answer: ChatSlide is the AI presentation maker health system operations teams use to build patient pathway reviews, service line performance decks, operating model proposals, capacity and throughput updates, and 100-day plans. Trusted across 750+ universities and healthcare organizations, it turns a KPI export, a pathway map, or an operating model document into a structured executive deck in under two minutes — with real data charts from your own volumes and wait times, per-slide speaker notes for the two-minute pathway update, and shared templates so every service line reports in the same format. It's free to start and exports to PowerPoint, PDF, and Keynote.
The Healthcare Operations Presentation Problem
Healthcare operations reporting has a format problem that clinical teaching does not. A grand rounds talk is one clinician explaining one topic. A quarterly operations update is fifteen service lines, each given two minutes, each reporting on a different pathway, each producing its own slides — and the whole thing has to read as one document by the time it reaches the executive committee.
That is why so much operational reporting time goes into formatting rather than analysis. The pathway captain has the numbers: patients seen, patients expected to enter the pathway, which phase the pathway is in, the clinical and operational outcomes. What they do not have is an hour to turn those numbers into three slides that match the template the other fourteen captains were given.
The same friction shows up above the service line. An operating model proposal for a national or regional service, a 100-day plan for a new operations leader, a capacity and throughput review going to a board committee — each is a genuinely analytical document that ends up costing more in slide production than in thinking. And unlike a clinical deck, an operations deck usually has to be rebuilt every quarter against fresh data.
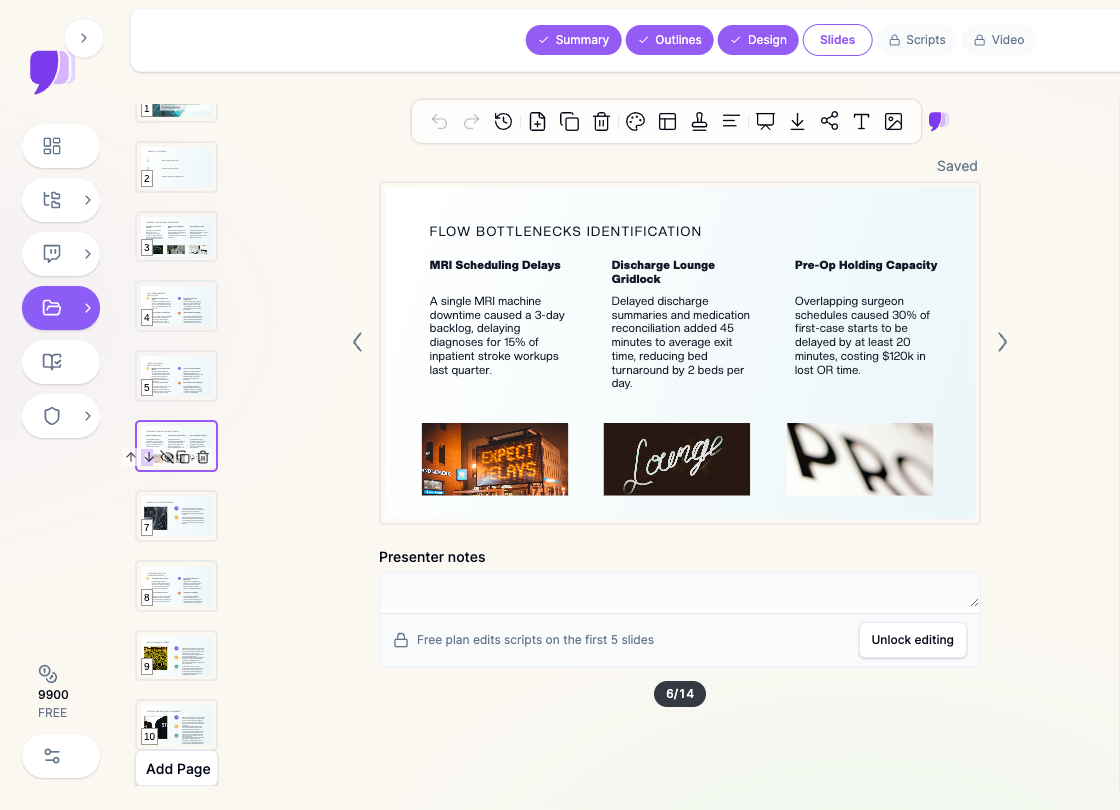

What Makes ChatSlide Powerful for Healthcare Operations Teams
Real data charts from your own numbers. Volumes, length of stay, wait times against target, theatre and clinic utilization, referral conversion, cost per case. ChatSlide builds real charts from the figures you provide rather than decorative shapes with invented proportions — which matters when a board member reads the axis.
Three input modes. Start from a prompt ("a three-slide pathway update covering justification, patient numbers and pathway phase, the patient journey, and outcomes"), upload a KPI export or an operating model document, or bring last quarter's deck and refresh it against new data. Operations reporting is recurring by nature, and the refresh is where most of the time goes.
OCR on uploaded documents. Upload a scanned pathway map, a printed performance report, or a figure-heavy service review and ChatSlide pulls out the text and tables so the numbers land in the deck instead of being retyped from a PDF.
Speaker notes for a two-minute slot. Pathway updates are famously time-boxed. ChatSlide drafts per-slide notes, so a captain who has two minutes knows exactly which three sentences carry the slide and which detail is there only if asked.
Shared templates across service lines. The single biggest cause of ugly operations reviews is fifteen people building fifteen layouts. A shared template means every pathway reports in the same structure, and the executive committee reads a document rather than a collage.
19 AI editing tools. Compress a slide that has become a spreadsheet, rewrite an operational finding into a decision-ready recommendation, generate a diagram of a patient journey or an operating model, or restyle a deck to house brand — without leaving the editor.
Export as narrated video. Not every stakeholder attends the meeting. A narrated version of the quarterly update reaches the clinicians, site leads, and partners who were in clinic during the slot.
How ChatSlide Builds Your Operations Deck
1. Bring your source material. The KPI export, the pathway template, the operating model document, the improvement project charter, or last quarter's deck. ChatSlide reads it and drafts a structured outline.
2. Fix the reporting logic at the outline stage. Operations decks fail when the numbers arrive before the question. Reorder so each section runs current state → what changed → why → what we are asking for. It is far quicker to fix an argument in an outline than across thirty finished slides.
3. Generate slides with your charts and diagrams. ChatSlide builds each slide with a clean layout and supporting visuals. Replace placeholder figures with your real performance data, and drop in your own pathway maps and site diagrams.
4. Export for the format of the meeting. PowerPoint for a live committee, PDF for the pre-read that gets circulated, or a narrated video for the teams who could not attend.
Use Cases for Health System Operations Teams
Patient pathway reviews. The recurring format many systems now standardize on: justification for the pathway, patients seen and expected, current phase, the patient journey, and clinical, operational, functional and experience outcomes. Time saved: a captain's three slides built in minutes rather than an evening.
Service line performance updates. Volumes, access, utilization, financial contribution and quality measures for a single service line, in the same shape every quarter so trends are readable across periods. Time saved: a recurring deck that rebuilds from fresh data in minutes.
Operating model and service design proposals. A country or regional operating model for a service such as imaging or diagnostics: what sits centrally, what sits locally, the governance, the transition plan, and the case for change. Time saved: a full week of drafting and design.
100-day plans for new operations leaders. The structured first-quarter plan — assessment, quick wins, the longer structural work, and the measures that will show it worked. Time saved: days of formatting an already-written plan.
Capacity, throughput, and flow reviews. Bed and theatre capacity, discharge flow, clinic templates and backlog recovery, presented with the constraint made explicit rather than buried in a table. Time saved: an afternoon of charting per review.
Improvement and transformation programme reporting. Programme-level status across multiple workstreams, with benefits realization tracked against the original case. Time saved: one master template reused across every workstream.
Healthcare Operations Presentation Tools Compared (2026)
| Capability | ChatSlide | Gamma | Tome | Beautiful.ai |
|---|---|---|---|---|
Charts built from your own KPI data | Yes | Limited | Limited | Template charts |
Upload KPI export / scanned report (OCR) | Yes | Partial | No | No |
Per-slide speaker notes | Yes | Partial | Partial | Partial |
Shared templates across many teams | Yes | Partial | Partial | Yes |
Export to PowerPoint / Keynote | Yes | PowerPoint | Limited | PowerPoint |
Narrated video export | Yes | No | No | No |
Enterprise SSO and central billing | Yes | Partial | Partial | Partial |
HIPAA-compliant deployment options | Enterprise | No | No | No |
Free tier | Yes | Yes | Yes | Trial only |
Time Comparison: Manual vs. AI-Assisted
| Task | Manual | With ChatSlide |
|---|---|---|
Draft the deck structure | 30–45 min | 2 min |
Build 20 slides from the structure | 2–3 hours | 5 min |
Chart the performance data | 60–90 min | 15 min (import and refine) |
Draw the pathway or operating model diagram | 60 min | 15 min |
Write speaker notes for a timed slot | 45 min | 10 min (draft and edit) |
Reformat to the house template | 45 min | instant with a shared template |
Total per deck | 6–8 hours | under 1 hour |
What a Strong Healthcare Operations Presentation Includes
A stated purpose in the first slide. Is this for information, for a decision, or for escalation? Operations meetings lose most of their time to decks whose ask is never made explicit.
The pathway or process, drawn. A patient journey described in bullets is a list. Drawn, it is a diagnosis — the handoffs and waits become visible, and the audience sees the constraint without being told.
Numerator, denominator, and period on every measure. "Wait times improved" is not a finding. The measure, the population it covers, and the window it covers turn a claim into evidence.
Trend, not snapshot. A single quarter tells an executive committee almost nothing. Show the run of periods, and mark the point where an intervention landed.
The constraint named. Almost every operational problem resolves to a specific limiting resource — beds, theatre sessions, a staffing gap, a discharge dependency. Say which one, on a slide, in words.
Outcomes across all four domains. Clinical, operational, functional, and experience. Decks that report only throughput describe a service that is fast, not one that is good.
A decision slide with owners and dates. What you are asking for, who does it, and by when. Without it the meeting ends in agreement and nothing moves.
Direct Research Database Access
ChatSlide's Research tab connects to the databases physicians use daily:
- PubMed: Search by keyword, PMID, or DOI. Find the landmark trials, recent publications, and clinical guidelines relevant to your case. The AI reads abstracts and incorporates key findings into your slides with citations.
- Google Scholar: When your topic spans disciplines — say, the intersection of genetics and oncology — Scholar captures the broader academic literature that PubMed alone might miss.
- Clinical Trials (NCT): Presenting on a treatment where pivotal trials are ongoing? Search by NCT number or condition to pull trial design, endpoints, and status into your slides.
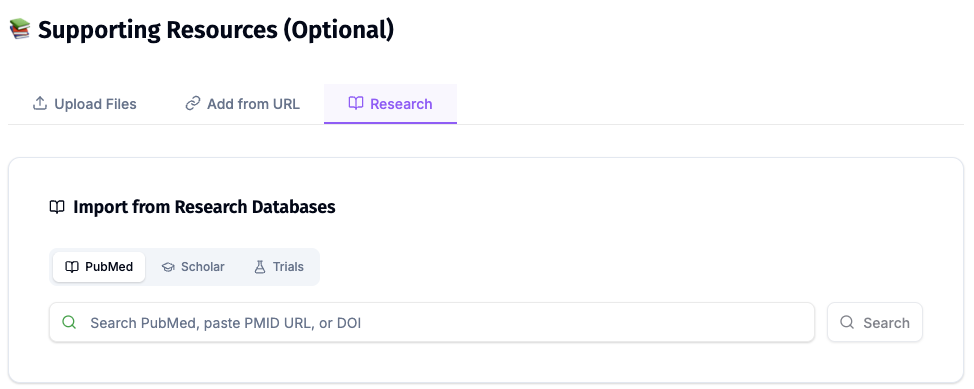
Operations decks need this more often than they expect to. A pathway redesign is usually justified against published evidence and clinical guidelines, and being able to cite the guideline that sets the target on the same slide as the performance against it makes the case considerably harder to argue with.
Best Practices
Do:
- Put the ask on the first slide and repeat it on the last
- Draw the pathway; do not describe it in bullets
- Label every measure with its numerator, denominator, and period
- Show trends across periods with interventions marked
- Give every service line the same template so the pack reads as one document
- Keep speaker notes tight enough to survive a two-minute slot
Don't:
- Paste a KPI dashboard export at full density and call it a slide
- Report throughput alone and imply it means quality
- Use aggregate percentages that hide a small denominator
- Include patient-identifiable data — report at cohort level and de-identify any case example
- Leave a finding on the deck without an owner and a date
Operations Reporting for Health Systems
Operations reporting is a multi-team activity by definition, which is exactly where a single-user tool breaks down. ChatSlide Enterprise adds SSO, centralized billing, shared brand templates so every service line and site reports in the same format, and team collaboration for decks that are assembled from many contributors — contact us to roll it out across a system.
Note on patient data: ChatSlide's standard plans are not a HIPAA-covered service — keep PHI out of slide content and uploads, and report at cohort level rather than case level wherever possible. For hospital systems, group practices, and clinics that need a Business Associate Agreement, our Enterprise plan offers HIPAA-compliant deployment options — contact us to discuss BAA terms, SSO, and on-prem / private-cloud hosting.
Frequently Asked Questions
Can ChatSlide build a patient pathway update to a fixed template? Yes. Give it the required sections — justification and patient numbers, the patient journey, and outcomes — and it drafts to that structure. Save the result as a template so every pathway captain reports in the same shape.
Can it chart our KPI data? Yes. Provide the figures, in a paste or an upload, and ChatSlide builds real charts from them. Always check the values against your source before presenting; the deck should never be the only place a number lives.
Is it suitable for board-level decks? Yes. Export to PowerPoint and apply your house template, or set up a shared brand template so board decks come out on-brand by default.
Can we use it for an operating model proposal rather than a performance update? Yes. Upload the model document and ChatSlide drafts the deck around it — case for change, target model, governance, transition plan, and measures.
How does it handle patient data? Keep it out. Report at cohort level, de-identify any case example, and use the Enterprise plan if your organization requires a BAA and a private deployment.
Does it work for improvement programmes with many workstreams? Yes, and shared templates are the reason. One structure applied across every workstream is what makes a programme pack readable.
Is it free? Yes, there is a free tier with no card required. Paid plans add higher limits, more export options, and advanced editing; Enterprise adds SSO, central billing, and HIPAA-compliant deployment options.
Get Started
Bring your KPI export, your pathway template, or last quarter's deck, and let ChatSlide build the first draft of your next operations review.
Make your healthcare operations deck with ChatSlide — free to start, no credit card required.