Quick Answer: ChatSlide is an AI sponsorship wrap report maker for event, partnership, and brand teams. Upload your post-event numbers, activation photos, media clippings, and the sponsor's style guide, and it builds a structured recap deck — overview, audience, partnership highlights, brand visibility, digital and social, earned media — in under two minutes, with real charts from your own data. Used by teams at 750+ universities and organizations worldwide, free to start, and exports to PowerPoint or PDF.
The Wrap Report Problem
The event ends on a Sunday. The renewal conversation starts on a Monday. In between sits the one document that decides whether a sponsor comes back: the wrap report.
It is a genuinely awkward deliverable. The data arrives from five places — the ticketing system, the web analytics, the social team, a PR clipping service, the on-site activation leads — in five formats, none of which look like a slide. The sponsor expects the report in their brand, not yours. And the person assembling it is usually the same person who has just finished running the event.
So wrap reports get late, or they get thin: a photo collage, a total attendance number, and a thank-you slide. That is a missed renewal. A sponsor reading a recap is asking one question — did we get what we paid for, and should we do it again? — and a deck that only shows footfall never answers it.
What Makes ChatSlide Powerful for Wrap Reports
3 Input Modes
- File upload — attendance exports, social analytics CSVs, media clipping PDFs, the signed partnership agreement, the sponsor's style guide, and last year's wrap report. Over 7 file types, with OCR so scanned clippings and screenshots are still readable.
- Web and URL — point it at the event site, the campaign landing page, or a published press hit to pull the context in.
- Text prompt — describe the report you need ("an 8-slide sponsor wrap report covering overview, audience, partnership highlights, brand visibility, digital and social, and earned media") and let the AI draft the structure first.
Real Charts from Your Own Numbers
Wrap reports live or die on the metrics slide. Give ChatSlide your actual figures and it builds real charts — attendance by day, impressions by channel, engagement rate against the prior year, share of voice — rather than decorative shapes you have to relabel by hand.
It Keeps Your Prior Decks
Last year's wrap report, the sponsorship deck you pitched with, and the activation brief all stay in your knowledge base. That matters more here than almost anywhere else, because the strongest wrap report is a direct answer to the pitch deck: you promised these deliverables, here is each one, delivered.
Sponsor-Specific Versions
One event, six sponsors, six different reports. Use the AI editing tools to retarget an existing deck to another partner — swap the activation section, re-cut the audience slide to their priority segment, restate the KPIs they actually signed up for — instead of rebuilding from an empty file each time.
On-Brand Output
Sponsors want the recap in their visual language. Upload their style guide with the rest of your inputs and apply a consistent theme across the deck, so the report looks like it came from the partnership rather than from a template.
Narrated Video Export
Not every stakeholder on the sponsor's side attends the debrief call. Export the deck as a narrated video and the brand manager can forward it to their CMO, who gets the story without a meeting.
How ChatSlide Builds Your Wrap Report
- Gather the inputs. Upload the post-event data exports, the activation photos, the media clippings, the partnership agreement, and the sponsor's style guide.
- Set the structure. Describe the sections your sponsor expects — the AI drafts an outline you can reorder before a single slide is generated.
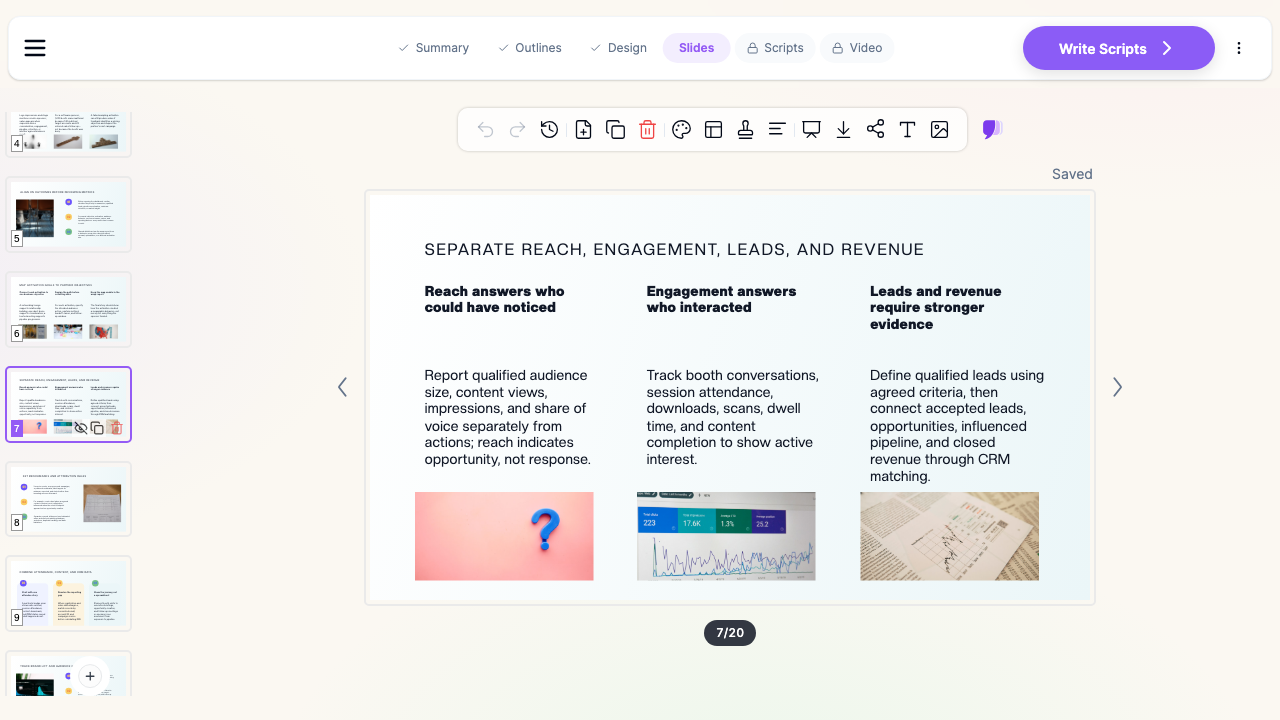
- Generate and chart. Slides are built with your numbers charted and your photos placed, with speaker notes for the debrief call.
- Edit and export. Refine with the AI editing tools, then export to PowerPoint, PDF, or a narrated video.
Use Cases
Post-event sponsor recap (fairs, festivals, expos)
The challenge: a multi-week public event with a dozen partners, each needing a report in their own brand within two weeks. How it helps: build the master report once from the shared event data, then fork a sponsor-specific version per partner — swapping only the activation, visibility, and KPI sections. Time saved: the second through twelfth reports stop being full builds.
Conference and trade show partnership reports
The challenge: the sponsor's marketing team wants reach and impressions; their sales team wants qualified leads and pipeline. How it helps: the deck separates reach, engagement, and lead metrics into distinct sections with explicit definitions, so both audiences find their number without arguing about the other's.
Agency post-campaign reports for brand clients
The challenge: the results sit across paid social, influencer, and on-site activation, in three different dashboards. How it helps: upload all three exports and let the AI consolidate them into one performance narrative with comparable charts.
Nonprofit and community event donor reports
The challenge: funders want impact, not marketing metrics. How it helps: the same structure works with attendance, participation, and outcome data in place of brand visibility — and exports as a PDF suitable for a board packet.
Wrap reports for teams
The challenge: several partnership managers producing reports that should look like one organization. How it helps: shared templates and a shared knowledge base keep structure and branding consistent across the team. Organizations that need SSO, centralized billing, and shared brand templates across departments can contact us about the Enterprise plan.
Wrap Report Tools Compared (2026)
| ChatSlide | Gamma | Tome | Beautiful.ai | |
|---|---|---|---|---|
Build from your data exports | Yes — upload CSVs and documents, with OCR | Limited | Limited | Limited |
Real charts from your numbers | Yes | Partial | Partial | Template charts |
Import last year's report | Yes — persistent knowledge base | No | No | No |
Scanned clippings / screenshots (OCR) | Yes | No | No | No |
PowerPoint export | Yes | Yes | Limited | Yes |
Narrated video export | Yes | No | No | No |
Free tier | Yes | Yes | Yes | Trial |
Time Comparison: Manual vs. AI-Assisted
| Task | Manual | With ChatSlide |
|---|---|---|
Consolidating data from ticketing, web, social, PR | 2-3 hours | 15 minutes (upload the exports) |
Drafting the narrative and section structure | 1-2 hours | Minutes (AI outline, you reorder) |
Building charts | 1-2 hours | Generated from your data |
Laying out photos and clippings | 1-2 hours | Generated, then adjusted |
Producing a second sponsor's version | Nearly a full rebuild | Retarget the existing deck |
What a Strong Sponsorship Wrap Report Includes
Keep the report to roughly 8-12 slides. Every section should map back to something the sponsor was promised.
1. Cover and context
Event name, edition, dates, the partner's name and logo, and the reporting period. Put the sponsor's brand first, not yours.
2. Event overview
What the event was, at what scale, and how that compares with the prior edition. Two or three headline figures, not twenty.
3. The audience
Who actually attended — size, and the demographic or professional segments the sponsor cares about. If the partnership was sold on reaching a specific segment, this slide proves it.
4. Partnership overview and activation highlights
The deliverables as signed, each marked delivered, with photos of the activation in situ. This is the slide that most directly answers "did we get what we paid for."
5. Brand visibility
Where the brand appeared and at what scale: signage, stage, wayfinding, program, merchandise. Estimated impressions belong here, with the basis of the estimate stated.
6. Digital and social
Campaign performance, website and landing page traffic, newsletter placements, social reach and engagement. Show the sponsor-attributable portion separately from total event performance.
7. Media and PR
Print, broadcast, and online coverage that named or featured the partner, with a few representative clippings.
8. Results against the agreed KPIs
If the agreement named specific KPIs, restate them and show the result against each. A partially-met KPI stated plainly reads as honest; an omitted one reads as avoidance.
9. Recommendations and next edition
Two or three concrete suggestions for the next edition. This is where a recap turns into a renewal conversation.
10. Thank you and contacts
Named contacts, next steps, and the date of the debrief call.
Best Practices
Do:
- Define every metric on the slide it appears on — what counts as an impression, an attendee, a lead.
- Separate reach from engagement from qualified leads. Collapsing them into one "results" number invites scepticism about all three.
- Show the sponsor-attributable share, not just the event total.
- Report against the agreement's own language, section by section.
- Include one or two things that did not work, with what you would change. Reports with no weaknesses are read as marketing.
- Send it within two weeks, while the event is still fresh for everyone approving next year's budget.
Don't:
- Lead with a photo collage. Photos support claims; they are not the claim.
- Use estimated impressions without saying how they were estimated.
- Compare against a different measurement method than last year without flagging it.
- Include personal data about attendees. Aggregate and anonymize — survey results and attendance data should go into the report as segments and totals, never as individual records.
- Recycle the pitch deck's projections as if they were results.
Frequently Asked Questions
Can it build the report from my data exports?
Yes. Upload attendance, web, and social exports along with your documents; ChatSlide reads them and charts your actual figures.
Can I import last year's wrap report?
Yes. Prior decks persist in your knowledge base, so this year's report can follow the same structure and be compared like-for-like.
Can I make a separate version for each sponsor?
Yes. Generate the master report, then use the AI editing tools to retarget it — swapping the activation, visibility, and KPI sections per partner.
Can I match the sponsor's branding?
Yes. Upload their style guide with your other inputs and apply a consistent theme across the deck.
Can it read scanned media clippings?
Yes — file uploads include OCR, so scanned print coverage and screenshots are readable by the AI.
Can I send the report to someone who missed the debrief?
Yes. Export a narrated video of the deck alongside the PowerPoint or PDF.
Is there a free tier?
Yes. You can start free, with no card required.
Can my team work from shared templates?
Yes — teams, folders, and sharing are supported. For SSO, centralized billing, and organization-wide brand templates, contact us about the Enterprise plan.
Get Started
Your sponsors decide on next year's budget within weeks of the event ending. A wrap report that arrives quickly, states the numbers clearly, and answers the agreement point by point is the cheapest renewal tool you have.
Upload your post-event data and build your sponsorship wrap report with ChatSlide — free to start, no card required.