
Quick Answer: ChatSlide is the AI presentation maker research faculty use to build advanced statistics and quantitative methods lectures — structural equation modeling, factor analysis, mediation and moderation, cluster analysis, PCA, and survival analysis. Trusted across 750+ universities, it turns a syllabus outline, a textbook chapter, or your own analysis output into a structured 30-slide lecture in under two minutes, with real data charts built from your numbers, LaTeX-friendly formula slides, per-slide speaker notes, and literature search built in. It's free to start and exports to PowerPoint, PDF, and Keynote.
The Advanced Statistics Lecture Problem
Teaching a first course in statistics is mostly a matter of sequencing: describe the data, introduce the sampling distribution, do a t-test, do an ANOVA. Teaching the second course is a different job entirely. Structural equation modeling, exploratory and confirmatory factor analysis, mediation and moderation, cluster analysis, principal components, Cox regression — each of these needs a path diagram or a plot before it means anything, and each one takes an hour of slide-building for every twenty minutes of lecture.
The problem compounds across a semester. A research methods sequence is not one deck, it is twelve or fifteen of them, and they have to agree with each other. The notation introduced in the regression lecture has to survive into the mediation lecture. The worked example from the factor analysis session should still be recognizable when it reappears under SEM. Building each deck from scratch guarantees drift.
Meanwhile the source material already exists. It is in the course outline, the textbook chapters, the analysis output from last year's example dataset, and the slides you built two years ago before you changed software. Retyping that into a new deck is the part of the work that teaches nobody anything.
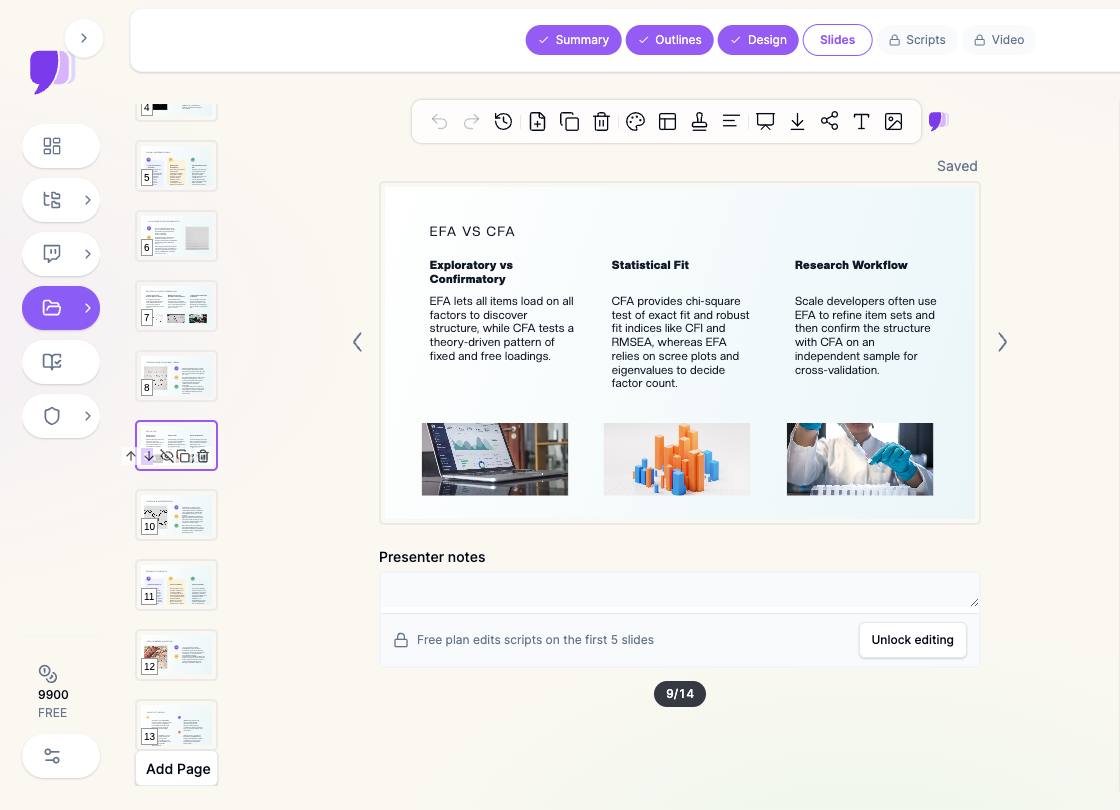

What Makes ChatSlide Powerful for Quantitative Methods Teaching
Three input modes. Start from a prompt ("a 30-slide graduate lecture on mediation and moderation analysis, covering the difference between the two, the Baron and Kenny approach versus bootstrapped indirect effects, and how to report each"), upload the chapter or reading you assigned, or bring last year's deck and restyle it. A methods lecture is almost always a rebuild rather than a blank page, and ChatSlide is built for the rebuild.
Real data charts from your own numbers. Scree plots, path coefficients, survival curves, cluster scatterplots, regression diagnostics — these are what the lecture actually turns on. ChatSlide builds charts from figures you provide instead of decorative shapes with invented proportions, so the numbers on the slide match the numbers in your output.
OCR on uploaded documents. Drop in a scanned textbook chapter, a printed output table, or a figure-heavy paper and ChatSlide pulls the text and tables out. Correlation matrices and fit-index tables land in the deck instead of being retyped cell by cell.
Literature search built in. Advanced methods lectures live on citations — the paper that introduced the fit index you recommend, the simulation study behind the sample size rule of thumb, the applied paper you are using as the worked example. ChatSlide can search the literature from inside the editor and pull findings into your slides with citations attached.
Per-slide speaker notes. A path diagram is not self-explanatory. ChatSlide drafts notes per slide, which matters most for the slides where the visual carries the idea and the words carry the caveat — assumptions, identification, what the model does not prove.
Consistent templates across a course. A semester-long methods sequence should look like one course. Shared templates keep the SEM lecture and the survival analysis lecture visually identical, so students spend attention on the content rather than re-orienting to a new layout each week.
19 AI editing tools. Split a dense slide into two, rewrite an explanation at a lower reading level for a mixed-background cohort, generate a diagram of a measurement model, or restyle the deck — without leaving the editor.
Export as narrated video. Methods lectures are the ones students re-watch. ChatSlide turns a finished deck into a narrated video, which handles the make-up session, the flipped classroom, and the student who needs to hear the assumptions section three times.
How ChatSlide Builds Your Statistics Lecture
1. Bring your source material. The course outline, the assigned chapter, your analysis output, or last year's slides. ChatSlide reads it and drafts a structured outline.
2. Fix the teaching sequence at the outline stage. Methods lectures fail when the intuition arrives after the formula. Reorder the outline so each technique goes research question → what the model assumes → the estimate → how to read the output → how to report it. Rearranging an outline takes a minute; rearranging forty finished slides does not.
3. Generate slides with your figures and notation. ChatSlide builds each slide with a clean layout, then you drop in your own plots, path diagrams, and output tables. Formula-heavy slides stay readable rather than turning into a wall of symbols.
4. Export in the format the course needs. PowerPoint for the lecture hall, PDF for the course site, or a narrated video for the asynchronous section.
Use Cases for Research Faculty and Methods Instructors
Graduate quantitative methods sequence. One deck per week across a semester — foundations and measurement, probability and sampling, descriptive and inferential methods, regression, advanced models — built from a shared outline so the notation stays consistent. Time saved: several days across a full sequence.
Structural equation modeling and factor analysis. The lectures that need the most diagrams: measurement versus structural models, EFA versus CFA, fit indices and what they do and do not tell you, modification indices and the temptation to chase them. Time saved: an afternoon of diagram work per lecture.
Mediation, moderation, and interaction effects. Where students most often confuse two concepts that look similar on a slide and behave nothing alike in an analysis — worth building carefully, once, and reusing. Time saved: a full deck rebuilt in minutes rather than hours.
Survival analysis and Cox regression for health researchers. Kaplan-Meier curves, censoring, the proportional hazards assumption and how to check it, hazard ratios and how to report them. Time saved: hours of plotting and formatting.
Cluster analysis, PCA, and dimension reduction. Unsupervised methods need worked visuals more than any other topic — the dendrogram, the elbow, the loading plot — and those visuals are exactly what takes the time. Time saved: an afternoon per lecture.
Statistics for teams and departments. Methods training also runs inside institutional research offices, clinical research units, and analytics teams. The same deck structure works for a two-hour internal workshop as for a graduate seminar. Time saved: one master deck restyled per audience.
Statistics Presentation Tools Compared (2026)
| Capability | ChatSlide | Gamma | Tome | Beautiful.ai |
|---|---|---|---|---|
Charts built from your own data | Yes | Limited | Limited | Template charts |
Upload chapter / output table (OCR) | Yes | Partial | No | No |
Literature search with citations | Yes | No | No | No |
Per-slide speaker notes | Yes | Partial | Partial | Partial |
Export to PowerPoint / Keynote | Yes | PowerPoint | Limited | PowerPoint |
Narrated video export | Yes | No | No | No |
Reuse one template across a course | Yes | Partial | Partial | Yes |
Free tier | Yes | Yes | Yes | Trial only |
Time Comparison: Manual vs. AI-Assisted
| Task | Manual | With ChatSlide |
|---|---|---|
Draft the lecture outline | 45–60 min | 2 min |
Build 30 slides from the outline | 3–4 hours | 5 min |
Produce plots and path diagrams | 1–2 hours | 20 min (import and refine) |
Pull and format supporting citations | 45 min | 10 min |
Write speaker notes | 60 min | 10 min (draft and edit) |
Restyle for a second audience | 60 min | 5 min |
Total per lecture | 7–9 hours | under 1 hour |
What a Strong Advanced Statistics Lecture Includes
The research question before the model. Every technique in the second course exists because a specific kind of question could not be answered by the first course. Open with the question, not the estimator.
A single worked dataset across the sequence. Reusing one example dataset all semester lets students see how the same data answers different questions under different models, and it removes the cognitive cost of learning a new context every week.
Assumptions stated as checkable claims. "Proportional hazards" means something a student can test and plot. Slides that state assumptions as tests rather than as vocabulary are the ones students can actually act on.
Output read line by line. The single highest-value slide in most methods lectures is an annotated screenshot of real output with arrows pointing at what matters and what to ignore.
Reporting standards. What goes in the manuscript: which coefficients, which fit indices, which confidence intervals, and in what table. Students who can run the model but cannot report it are not finished.
Honest limits. Model fit is not causal identification, a significant indirect effect is not a mechanism, and a cluster solution is a description rather than a discovery. One slide of limits per technique prevents years of misuse.
Direct Research Database Access
ChatSlide's Research tab connects to the databases physicians use daily:
- PubMed: Search by keyword, PMID, or DOI. Find the landmark trials, recent publications, and clinical guidelines relevant to your case. The AI reads abstracts and incorporates key findings into your slides with citations.
- Google Scholar: When your topic spans disciplines — say, the intersection of genetics and oncology — Scholar captures the broader academic literature that PubMed alone might miss.
- Clinical Trials (NCT): Presenting on a treatment where pivotal trials are ongoing? Search by NCT number or condition to pull trial design, endpoints, and status into your slides.
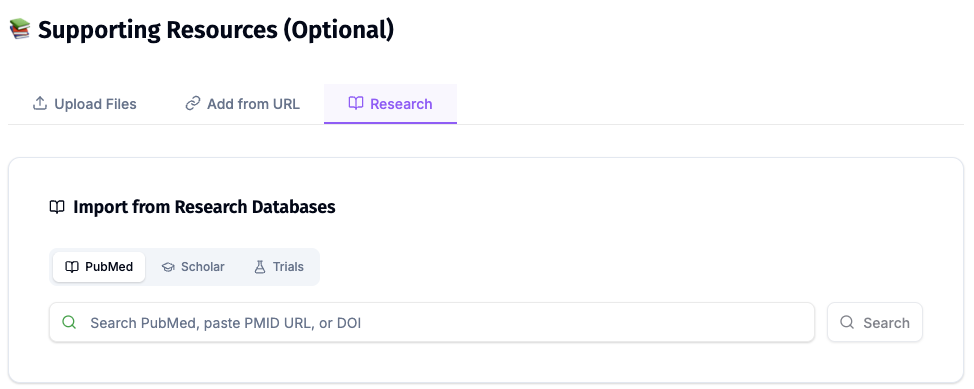
For a methods lecture this matters more than it first appears: the applied papers you use as worked examples, the trial whose survival analysis you are walking through, and the simulation study behind a sample size recommendation are all one search away from being on the slide with a citation attached.
Best Practices
Do:
- Build the outline first and teach it to yourself before generating slides
- Reuse one example dataset across the whole sequence
- Put an annotated real output table in every technique lecture
- State each assumption as something a student can check
- Keep one formula per slide, with the plain-language reading underneath
- Reuse a single course template so the visual language stays constant
Don't:
- Open with the estimator instead of the question
- Paste a correlation matrix at full density and call it a slide
- Present fit indices without saying what a bad value would look like
- Rely on generated charts without checking the numbers against your output
- Upload identifiable participant-level data to build an example — de-identify or simulate first
Statistics Training for Departments and Research Units
Methods teaching rarely stays with one instructor. Departments run sequences, clinical research units run internal workshops, and analytics teams run onboarding. ChatSlide Enterprise adds SSO, centralized billing, shared brand templates so every deck in a program looks like it belongs to the same program, and team collaboration for co-taught courses — contact us to set it up for a department or research unit.
Note on participant data: ChatSlide's standard plans are not a HIPAA-covered service — keep PHI and identifiable participant records out of slide content and uploads, and teach from de-identified or simulated data. For hospital systems, clinical research units, and academic medical centers that need a Business Associate Agreement, our Enterprise plan offers HIPAA-compliant deployment options — contact us to discuss BAA terms, SSO, and on-prem / private-cloud hosting.
Frequently Asked Questions
Can ChatSlide build a structural equation modeling lecture? Yes. Describe the level and the scope — measurement versus structural models, fit indices, identification — and ChatSlide drafts the outline and slides. Bring your own path diagrams and output for the technical slides.
Will it produce the actual statistical output? No, and it should not. ChatSlide builds the teaching deck around your analysis; the analysis itself stays in your statistical software. Import your plots and tables, and ChatSlide handles the layout, the explanation, and the notes.
Can it handle formulas? Yes. Formula-heavy slides render cleanly, and the AI editing tools can split an overloaded derivation across slides so each step stays readable.
Does it work for a whole course rather than one lecture? Yes, and that is where it saves the most. Build one deck, save the template, then generate the rest of the sequence against the same structure so notation and layout stay consistent.
Is it useful for qualitative methods too? Yes. The same workflow builds lectures on research design, data collection methods, coding and thematic analysis, and writing up — the outline stage is where the difference shows, not the tooling.
Can I upload my own dataset? Upload summary tables, output, and figures rather than raw participant-level data. That is enough to build every slide, and it keeps sensitive records out of the deck.
Is it free? Yes, there is a free tier with no card required. Paid plans add higher limits, more export options, and advanced editing.
Get Started
Bring your course outline, your assigned chapter, or last year's deck, and let ChatSlide build the first draft of your next methods lecture.
Make your statistics lecture with ChatSlide — free to start, no credit card required.