Quick Answer: ChatSlide is the AI presentation maker for teaching genomics, bioinformatics, and the wider omics stack. Used at 750+ universities, it turns your outline — or an uploaded paper, syllabus, or lab dataset — into a structured, figure-rich lecture deck in under two minutes: real charts from your own sequencing data, diagrams for each omics layer, PubMed-grounded "recent advances" slides, and speaker notes that keep the screen clean. Free to start, exports to PowerPoint, Keynote, Google Slides, and PDF.
The Genomics Lecture Problem
Omics is brutal to teach on a deadline. A single survey lecture has to move from DNA sequencing to genomes, transcriptomes, proteomes, and metabolites — each its own field, each with its own jargon, pipelines, and figures. The science also dates fast: a deck built around microarrays now looks archaic next to long-read sequencing, single-cell atlases, and spatial transcriptomics. And every concept demands a clean visual — a central-dogma-to-omics map, a volcano plot, a pathway diagram — that takes longer to lay out than the talk itself.
So you lose an afternoon to one 50-minute lecture, end up with a wall-of-text slide on "Types of Omics" students photograph and never reread, and the elegant through-line — why transcriptomics and proteomics disagree, what a metabolite actually tells you — never makes it onto the deck.
What Makes ChatSlide Powerful for Genomics & Omics Teaching
This is where ChatSlide earns the lecture slot — it is built for dense, figure-heavy science, not generic marketing decks.
Three input modes
Start from a topic ("Introduction to functional genomics for an upper-division course"), upload a document (your syllabus, a review paper, a methods PDF, last year's slides), or paste your notes. ChatSlide reads the source and proposes a teaching-ordered outline you control.
Real charts from your own data
Genomics is taught in plots — volcano plots, PCA of expression matrices, coverage tracks, enrichment bars. Hand ChatSlide a CSV or table and it renders an actual chart on the slide, not a screenshot you re-export every time the numbers change.
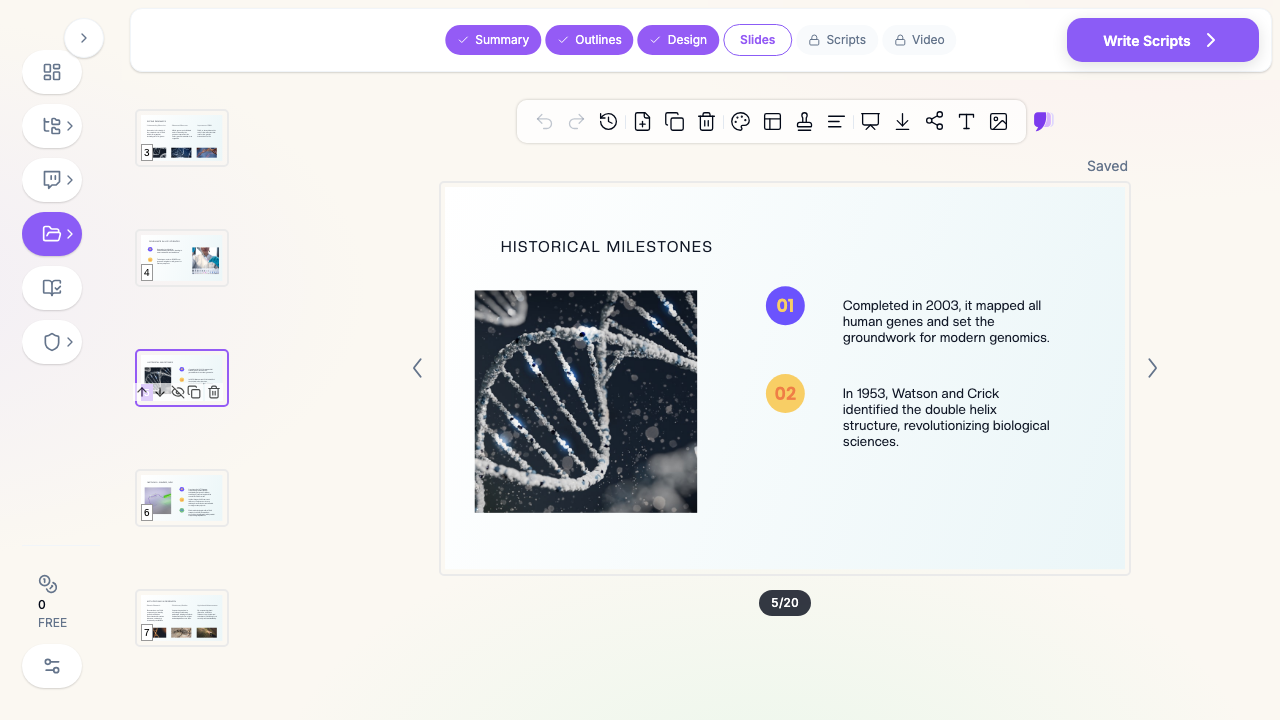
Omics-aware figures
Each layer gets its own visual: a sequencing-workflow schematic for genomics, a splicing/expression diagram for transcriptomics, a mass-spec pipeline for proteomics, a pathway map for metabolomics — so concepts build in layers instead of crowding one diagram.
Literature grounding
The Research tab searches PubMed and Google Scholar by keyword, PMID, or DOI, reads the abstracts, and works findings into your slides with citations — so your "recent advances" slide reflects this year's papers, not a textbook three editions behind.
Speaker notes that keep slides clean
The full mechanism lives in your narration; the slide shows the figure and a short label. ChatSlide writes per-slide speaker notes, so the deck doubles as your lecture script without a single wall of text on screen.
19 AI editing tools
Rewrite a slide for a lower level, split an overloaded slide, shorten bullets, or change the emphasis — without rebuilding the deck. Calibrate the same core lecture from intro survey to graduate seminar in a few clicks.
How ChatSlide Builds Your Genomics Deck
- Give it the subject and the audience. "Omics overview for a molecular biology course — assume students know the central dogma but not RNA-seq, mass spec, or metabolomics workflows." Telling it what to skip and what to develop is the single biggest quality lever.
- Edit the outline as the expert. ChatSlide drafts an editable outline first — say Sequencing → Genomics → Transcriptomics → Proteomics → Metabolomics → Integration. Reorder anything that breaks the dependency chain, delete below-level sections, and rename vague headings into precise learning units.
- Generate slides and add figures. ChatSlide builds the deck and populates each slide with relevant diagrams; upload your own lab figures where they teach better than stock.
- Export where your classroom lives. PowerPoint and Keynote for the podium, Google Slides for collaboration, PDF for the LMS — build once, deliver everywhere.
Use Cases for Bioinformatics Educators & Researchers
- The omics survey course. One coherent series — genomics, transcriptomics, proteomics, metabolomics — built on a shared template so the course reads as one story instead of five disconnected decks. Saves a full week of prep across the unit.
- Lab meeting & journal club. Drop in a paper's PMID and your own results table; get a clean methods-and-figures deck instead of pasting screenshots at midnight. 30+ minutes back per presentation.
- Grant and thesis-committee updates. Turn a progress report into a figure-first deck — pipelines, QC metrics, differential-expression results — with the narrative in speaker notes.
- Workshops & bioinformatics bootcamps. Generate parallel decks for variant calling, RNA-seq, and pathway analysis modules that all share one visual vocabulary.
- Programs & departments. Standardize a genomics-curriculum look across instructors with shared brand templates, team collaboration, SSO, and centralized billing — contact us for team and program rollouts.
Genomics Presentation Tools Compared (2026)
| Capability | ChatSlide | Gamma | Tome | Beautiful.ai |
|---|---|---|---|---|
Upload a paper/dataset as source | Yes | Limited | Limited | No |
Real charts from your CSV | Yes | Partial | No | Template charts |
PubMed / Scholar citation grounding | Yes | No | No | No |
Per-slide speaker notes (auto) | Yes | Partial | Partial | No |
PowerPoint + Keynote + Google Slides export | Yes | PPTX/PDF | PPTX/PDF | |
Free tier | Yes | Yes | Yes | No |
Time Comparison: Manual vs. AI-Assisted
| Task | Manual | With ChatSlide |
|---|---|---|
Structure a 50-min omics lecture | 45 min | 5 min |
Draft slides for each omics layer | 90 min | 5 min |
Build figures / charts | 60 min | included |
Pull and cite recent literature | 40 min | 10 min |
Write speaker notes | 30 min | included |
Total | ~4.5 hrs | ~25 min |
What a Strong Omics Lecture Includes
The product builds the deck; your judgment makes it teach. The best genomics and bioinformatics lectures share a few traits:
- One concept per slide, built in layers. The omics stack is not one diagram — sequencing, genomics, transcriptomics, proteomics, and metabolomics each earn their own visual. Cram them together and students copy the slide and understand none of it.
- Figures that carry the argument. In bioinformatics the plot is the explanation. A well-labeled volcano plot or PCA teaches more than three bullets describing the same result.
- A through-line from data to biology. Students remember why transcriptomics matters when you connect the assay (RNA-seq) to the payoff (a differential-expression result that changed a diagnosis). Method without meaning reads as trivia.
- Calibrated depth. An intro survey of "What is a genome" and a graduate seminar on "Batch correction in single-cell integration" are different decks. Match where your students actually are.
- Current examples. Long-read sequencing, single-cell and spatial atlases, and AI-driven structure prediction turned textbook abstractions into headline science — anchor the fundamentals in a recent breakthrough.
Best Practices
Do
- Lead each unit with a question ("Why do the transcriptome and proteome disagree?") instead of a definition.
- Reuse a visual vocabulary — one color for DNA, one for RNA, one for protein — across every slide.
- Upload your own pipeline figures and result plots; they teach better than stock.
- Mark the two or three exam-relevant "must-know" slides and treat the rest as compressible enrichment.
Don't
- Don't put the full pipeline on the slide — the detail belongs in speaker notes.
- Don't paste low-resolution plot screenshots when you can render a real chart from the data.
- Don't ship a generic, evenly-weighted summary; tell the AI what to emphasize.
A light note on data: keep any unpublished or restricted sequencing data and identifiable participant information out of slide content and uploads on standard plans. For research groups and programs that need single sign-on, centralized control, or private-cloud / on-prem deployment, our Enterprise plan covers it — contact us.
Frequently Asked Questions
Is this different from a general molecular biology slide maker? Yes. If you are teaching the central dogma, RNA technologies, CRISPR, and gene expression, see our molecular biology lecture guide. This page is for the omics / bioinformatics angle — genomics, transcriptomics, proteomics, metabolomics, and data-analysis workflows.
Can it make charts from my sequencing results? Yes — upload a CSV or table and ChatSlide renders a real chart (bar, volcano-style scatter, line, PCA-style) directly on the slide.
Does it cite real papers? The Research tab searches PubMed and Google Scholar by keyword, PMID, or DOI and incorporates findings with citations, so your literature slides stay current.
Can I build a whole course, not just one lecture? Yes. Reuse one design across genomics, transcriptomics, proteomics, and metabolomics decks so the series reads as a single coherent story.
What formats can I export? PowerPoint, Keynote, Google Slides, and PDF.
Is it free? There is a free tier to build your first deck — no credit card required.
Can my department standardize on it? Yes — shared brand templates, team collaboration, SSO, and centralized billing are available; contact us for program rollouts.
Get Started
Genomics and bioinformatics lectures will always demand your judgment — what to emphasize, what to simplify, where the field is heading. They should not demand an afternoon of redrawing pipelines and reformatting bullets. ChatSlide turns the outline in your head — or the paper on your desk — into a structured, figure-rich omics deck in minutes.
Whether it is a single guest lecture on RNA-seq or an entire omics course from sequencing through metabolomics, make your genomics presentation with ChatSlide free today. Bring the biology — let the slides build themselves.